An approach to data that is based on accuracy, openness, and transparency is a critical ingredient for both economic research and effective policy design. Here at the Economics Observatory, we want to keep learning, improving and innovating in the way we present our data.
Newsletter from 28 October 2022
Data were a cause for celebration for the Economics Observatory team this week as we passed two million views on our website. Google also tells us that our ‘dwell time’ – how long people hang around on a page – is far above the industry standard. So, people seem to be enjoying the blend of economics and policy that we are publishing. Congratulations to the team and thank you to all our contributors for making this possible.
Too often data are a cause for concern. We are living through a data revolution but are beset by data problems. Charts and analysis are often out of date. Many seen online are opaque, both in terms of the provenance of the data and the way the numbers have been manipulated.
The very worst are plain fake. Even when charts are accurate, they often look dreadful with fuzzy lines in a dull blue that would make Yves Klein – the master of that colour – shudder.
The UK boasts some giants when it comes to data – from William Playfair to Florence Nightingale to John Snow – so we have the guidance to do this work well. At the Economics Observatory, we are launching a new project to put things right.
Cousin FRED
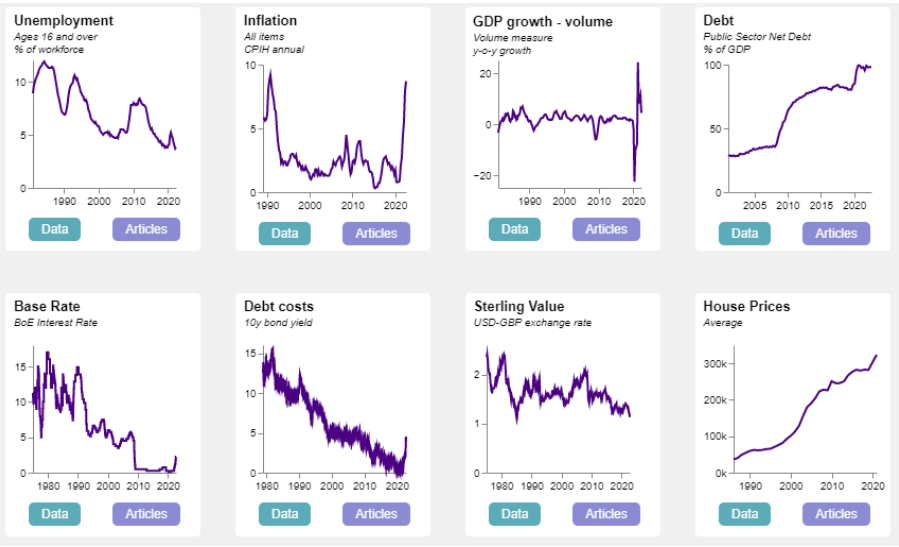
The idea is to build our existing Data Hub into something like a cousin for FRED, which we think is the best data bank on the planet. I say cousin rather than twin, since we want to emulate that success, but make some changes too. As a first step, we’ve built a modest new dashboard, which can be found here.
The dashboard pulls data for several metrics directly from the Office for National Statistics (ONS) and displays the numbers live in the page. All the underlying code is open source, and the background data can be checked easily and quickly.
We think this type of unified, live and automatically updating service is dearly needed here in the UK and are excited to have started building something that meets this challenging brief.

Behind the scenes, there are a few differences here, as they set a kind of blueprint for what we intend to work on:
- Auto-updating. Our hub should be linked directly to official data sources (via APIs), so that the charts here refresh and update when new numbers are released. (I’m now in my 20th year as a professional economist and I never want to make a chart of inflation or unemployment again.)
- Transparent. Everything that happens should be transparent. In one click, the user should be able to get back to the raw data. Code too should be open so that the axes set and colours chosen can be inspected, checked and verified.
- Open and social. Our analysis should convert to PNG files with one click so that our readers can use them in presentations or discussions involving data. We will also work to make our code shareable, so that ECO charts can be run as small plug-ins to external sites.
- Interactive. We will make our charts as customisable as possible, allowing you to toggle metrics, click data points to find out more or highlight trends.
- Contextualised. Each chart should link to a page on the Observatory site so that users can dig deeper and read about related research and policy questions. There are some great data hubs out there – the OECD’s deserves a mention – but we think they are too complex looking and off-putting to some users.
- Well designed. We want to involve designers from the start of the process to ensure that the colours and layouts that we choose are as inspiring and accessible as possible.
We’ve already worked out how to do some of the steps above – this dashboard, for example, should auto-update as soon as new ONS numbers come out – but there is much more to do.
Get involved
We need our users’ help with this. Please get in touch with ideas or proposals for the upgraded hub. We are currently in the process of forming an advisory board with representatives from all the main UK data providers, journalists, business leaders, developers and specialists in visualisation.
If you have ideas about our approach, or requests for charts you would like to see, please let us know. To access of code and data, see our GitHub pages. You can write to us at: office@economicsobservatory.com.


