Following the cancellation of public exams, Ofqual used an algorithm based on rankings of students within a school, combined with each school’s historic performance, to allocate A-level grades. The resulting outcry led to grades instead being awarded based on school assessments.
A-level examinations are taken by young people in England, Wales and Northern Ireland at the end of year 13 of school or college education. Most take three or four A-levels, and the results are important, as universities offer places conditional on the grades achieved in those assessments. Similarly, apprenticeships and post-education employment can be conditional on achieving a minimum level. A-levels are graded from A* to U, with A* being the highest grade.
For university admissions, if a school student achieves the terms of their conditional offer, the university has a contractual obligation to accept them (UCAS, 2020a). While universities may be able to admit students who just miss the terms of their offer, students whose results meet their conditional offer are prioritised, and if there are no places remaining, even missing an offer by a single grade (for example, achieving AAB, when the offer was AAA) can lead to losing the place.
As such, the reduction of grades, even by a single grade, can have significant impacts on where students attend university. Further, if students experience a large drop in their A-levels, it may lead to them being unable to study their chosen subject. For example, the minimum offer for veterinary science in the UK is BBC (UCAS, 2020b).
In March 2020, schools across the UK had to close because of Covid-19. This was accompanied by an announcement that all A-level and GCSE exams would be cancelled, raising the question of how (or if) students would be awarded A-level grades, in order to go on to their next phase of education or employment.
While some students will have completed AS levels in their subject during year 12, which could have been used to obtain a signal of their potential, this was only a minority of students. The 2012 reforms to A-levels (see, for example, Sutch et al, 2015) led to a reduction in the number of students taking AS levels from 270,500 in 2016 to 64,810 in 2018 (Department for Education, DfE, 2018).
The 2012 reforms were also associated with a reduction in coursework, and an increased reliance on terminal assessment at the end of the course of study (normally in June). So for most students, exam boards had no reliable signals about the students’ attainment levels.
Centre assessment and the case for standardisation
As the decision had been made to cancel public exams, the A-level grades that students were to receive would, instead, be based on schools’ and colleges’ assessment of students’ ability. Schools and colleges (centres) were asked to use evidence about a student’s prospective performance (including mock exams, coursework, classwork, etc.) to produce an assessment of what grade they expected the student to achieve.
While this assessment was carefully moderated within a centre (so that if, for example, different teachers within a centre had different expectations of students’ performance, these would be standardised), there might be differences across centres in the levels used.
When students apply to university, through UCAS (the Universities and Colleges Admissions Service), schools provide predictions of students’ performance in the assessments. But there is evidence that there are clear differences in the accuracy of these predictions, with high achieving students from state schools receiving lower predictions of performance than similarly achieving students from private schools (Murphy and Wyness, 2020). While the UCAS prediction is made much earlier than the requirements for the 2020 A-levels, and takes into account less information, this does raise the question of how to standardise the centre assessments.
The second case for standardisation was to try to avoid grade inflation; since centres were asked to assess students’ potential, it is natural that students on a borderline between grades might be placed in the higher classification, as an indication of what the student would be capable of achieving on a good day. But if all borderline students were pushed up to the higher grade, this would lead to grade inflation.
Gavin Williamson, the Secretary of State for Education, said that in awarding grades based on the judgements that centres had made, ‘Ofqual [the Office of Qualifications and Examinations Regulation] should ensure, as far as is possible, that qualification standards are maintained and the distribution of grades follows a similar profile to that in previous years.’ (DfE, 2020). As such, a key element of the standardisation approach used was to avoid grade inflation.
How the standardisation algorithm worked
There are many ways that Ofqual could attempt to standardise the grade distributions, but in order to understand what went wrong, it is also important to understand the methodology that was chosen by Ofqual. The details of how the algorithm was applied are available in the interim report (Ofqual, 2020a), and the technical requirements document (Ofqual 2020b).
Centres were asked to produce ‘centre assessment grades’ (CAGs) and a rank ordering of students within the centre for each subject. The CAGs were based on all of the available information, such as mock exams, classwork and coursework, up to 20 March 2020 as an assessment of what grade each student was expected to achieve. But for most students, the rank ordering was more important than the CAG, as this was what would be used to calculate the grades.
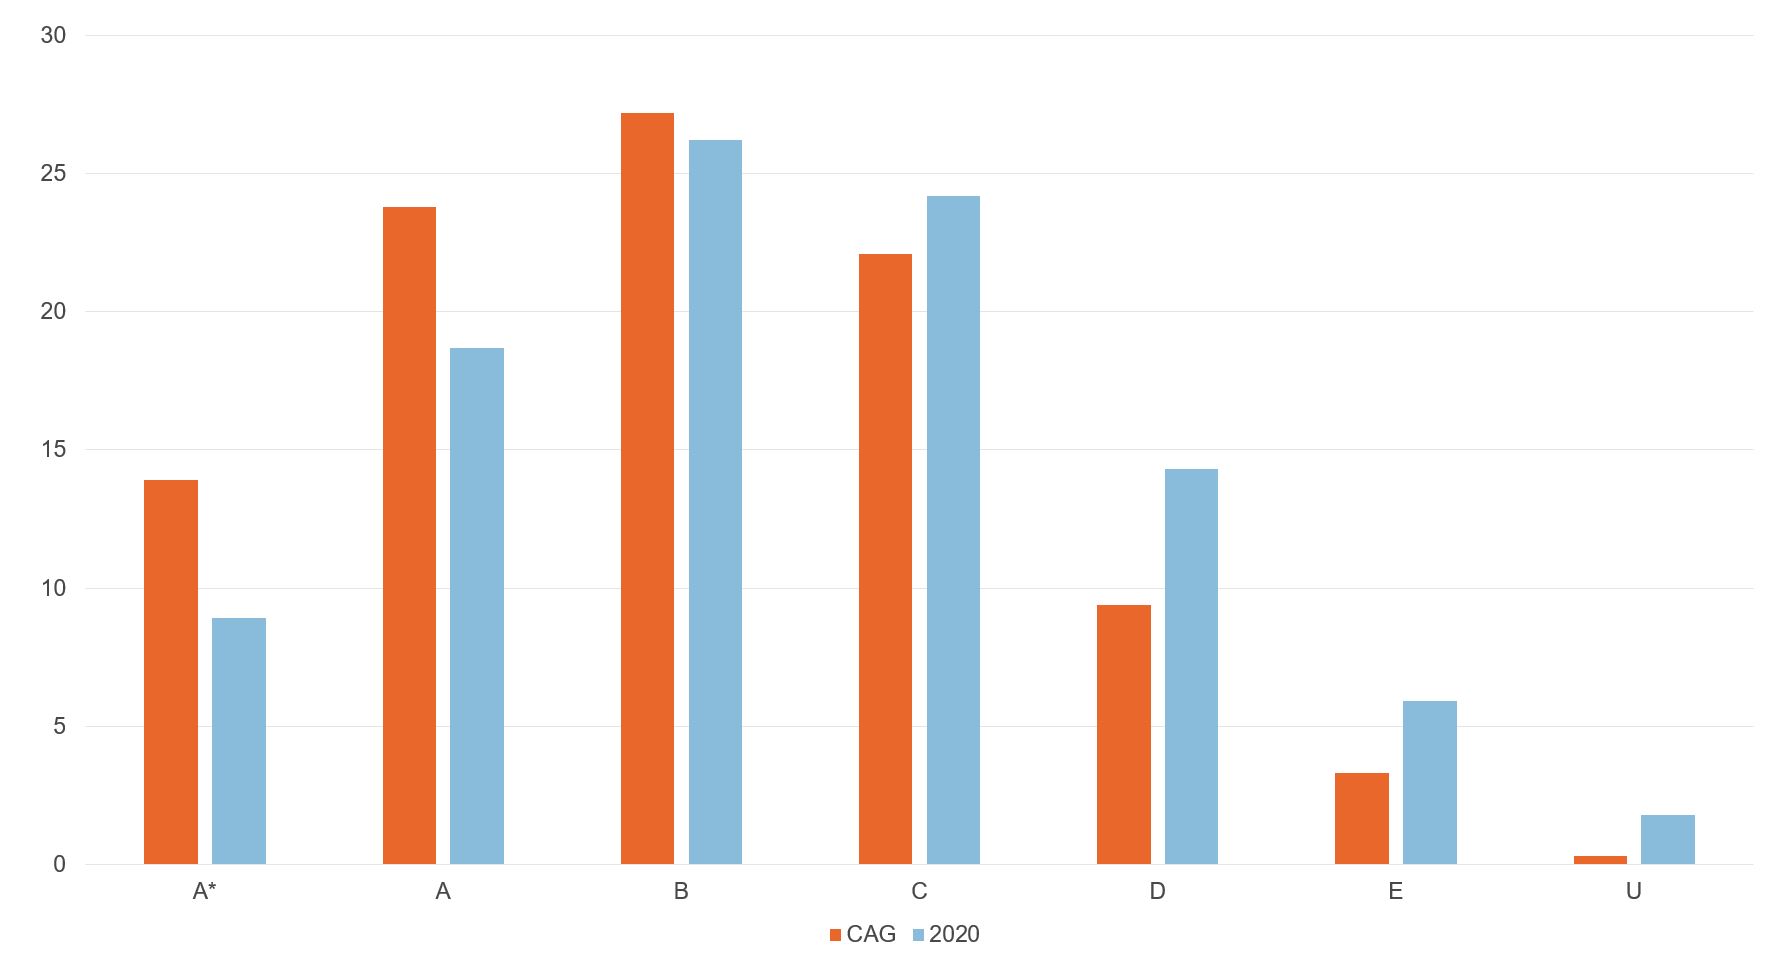
Had the CAGs been used directly to calculate final grades, the proportion of students with an A* would have increased from 7.8% to 13.9%, while almost two-thirds of students (64.9%) would have gained a B or above, compared with just over half (51.6%) in 2019 (Ofqual 2020a, p134, JCQ, 2019). This would have violated the requirement to ensure that grades followed a similar profile to previous years.
The principles of standardisation used the historic performance of a centre to estimate the distribution of grades available to students. Much of the year-on-year variation in exam performance can be attributed to the student make-up of the school or college (Goldstein et al, 1993). So the principle of standardisation was to look at the historic distribution (usually based on three years of data) of grades achieved by the centre, adjusted by the relative performance of the 2020 A-level cohort at GCSE, compared with the previous three cohorts, and then grades would be allocated to students based on their ranking within the centre cohort.
If this year’s cohort were higher-performing at GCSE than previous cohorts, then the range of grades available to students would be higher, on average; while if this year’s cohort was lower performing at GCSE, then the range of grades would be lower.
This adjustment did raise the potential issue that if student A had performed unexpectedly badly in their GCSEs (for example, due to illness), then this would have the effect of pulling down the available grades for all students. In practice, this could mean that student B’s grade at A-level could be pulled down by student A’s performance at GCSE.
The algorithm, up to this point, established the distribution of grades available to each centre for each subject. Students were allocated to grades based on their ranking within the subject-cohort at the centre.
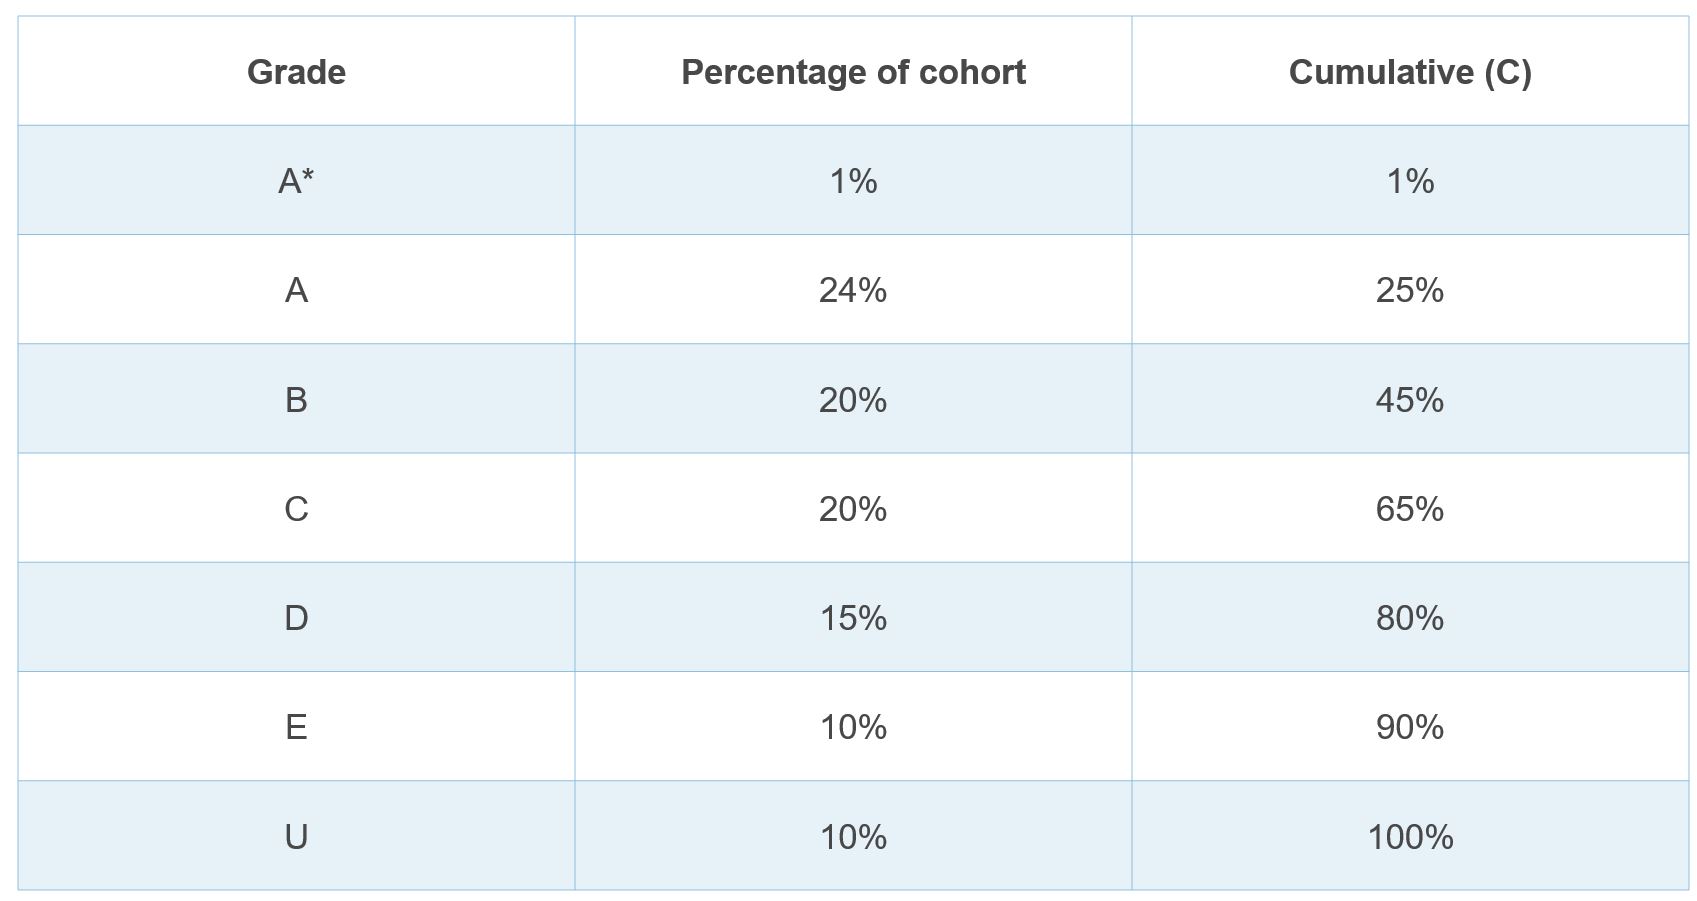
Suppose the algorithm determined that the distribution of grades within a centre was such that 1% of students gain A*, 24% A and so on (as below). Then the top 1% would be awarded at least an A*, the top 25% would be awarded at least an A and the top 45% would be awarded at least a B.

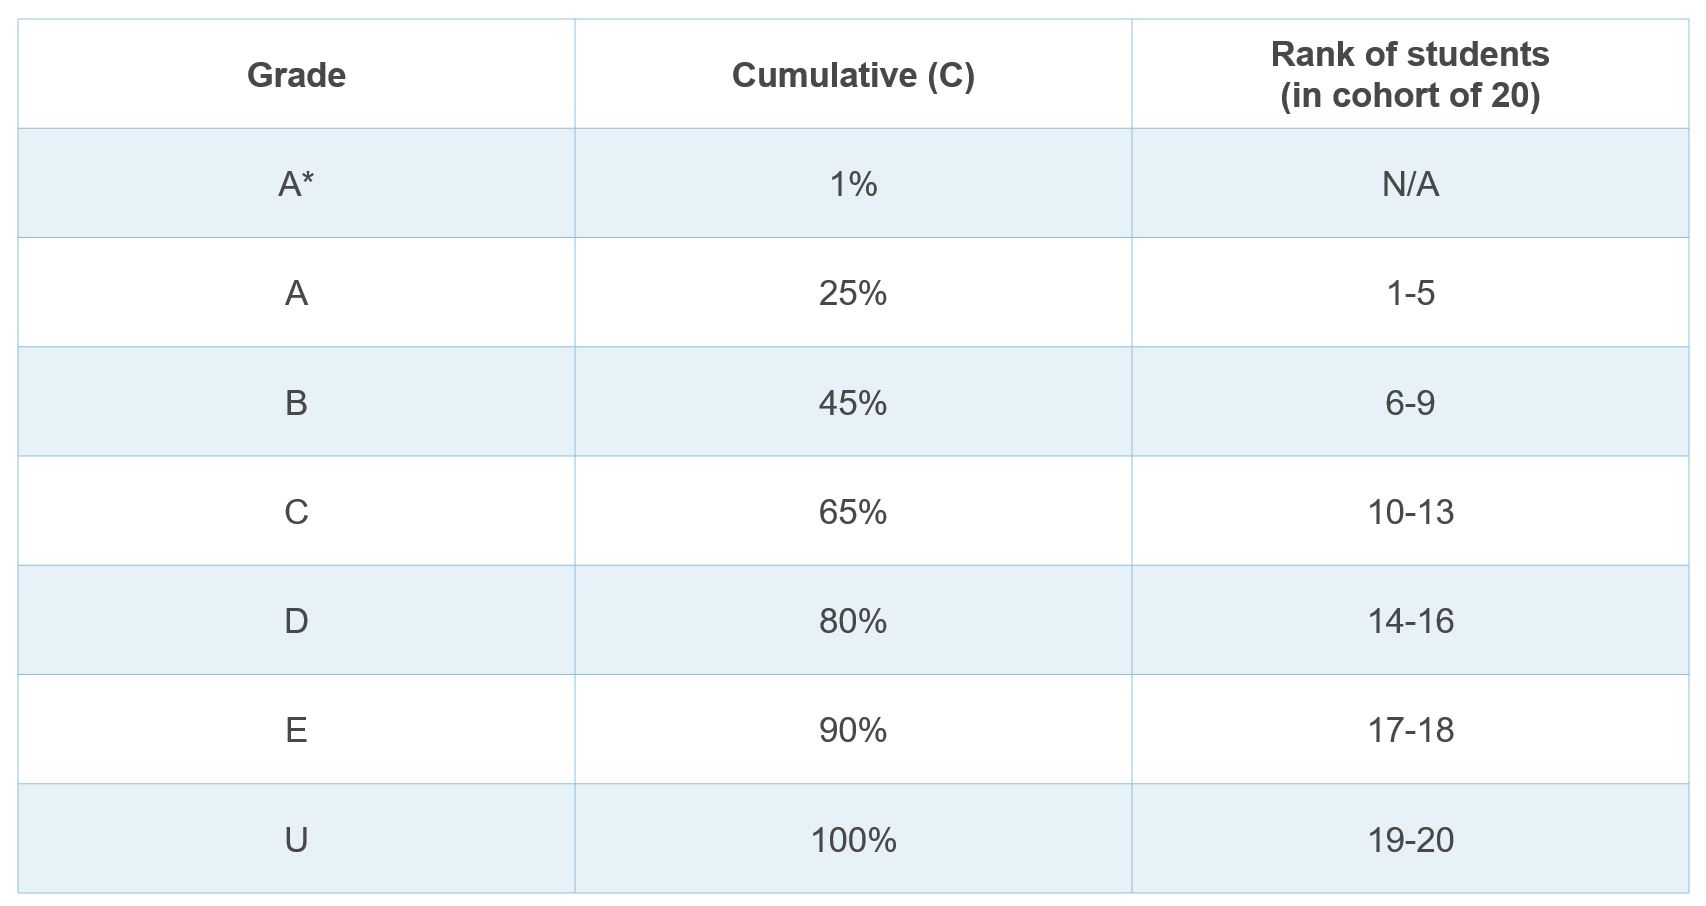
The grade that a student is awarded is based on their rank within the cohort. In order to calculate the grade awarded by the algorithm, the student’s percentile in the cohort was calculated as P=(Rank-0.5)/(Number in cohort) , and the awarded grade was the highest grade such that P
In this example, the grades would be allocated thus:

Even though the distribution allowed for students to be awarded an A*, because of the relatively small size of the cohort (20), it turns out to be impossible for even the top-ranked student to be awarded an A*, irrespective of how good that student’s performance had been up to that point.
Of even more concern was the way that the algorithm awarded grades at the bottom end of the distribution. Because, historically, students had been awarded U grades (a fail) in this centre, the algorithm insists that students be awarded U grades in this cohort; in the example above, two students would be awarded a U grade, irrespective of their own attainment.
A student could have been assessed by their school as being capable of gaining a B, but as the distribution insists that there had to be some U grades in this centre, the bottom ranked students would be awarded the U grade. By using the rank of the students as a starting point for allocating grades, rather than the CAGs, the algorithm ignored important information. Across the UK, approximately 1,400 results were three (or more) grades lower than the initial CAGs; in these cases, it is likely that the algorithm was simply faulty, with no sense-check for these students.
A final issue with the mapping of students to grades was that, except for the largest centres, centres were not allowed to rank students equally; in the example above, even if the centre believed that the ninth and tenth ranked students were quantitatively identical, the student who was ranked ninth would gain a higher grade than the student ranked tenth. In larger cohorts, where it may be difficult to distinguish between multiple students, this can lead to a large number of borderline students being awarded the wrong grade.
The algorithm implicitly relies on having sufficient data to provide a representative distribution; but when samples are small, sampling variation will be very large, and it would therefore be unlikely that the past performance of the school (even when adjusted by performance at GCSE) will give a good measure of the distribution of grades this year.
As such, if a centre had a small number of students (fewer than five, based on a harmonic average in a cohort), then the grade was awarded based on the CAG; and if the number of students was between five and 15, students would be awarded a blend of the CAG and the grade constructed by the algorithm.
Figure 1. Comparison of grades from CAG and the initial grade awarded on 13th August 2020

Source: Constructed based on data from Ofqual 2020, p134
On average, the results released to students on 13 August (constructed by the algorithm for most students, but the CAGs for those in small centres) were lower than the grades initially submitted by centres to Ofqual in the CAGs; 39.1% of entries were downgraded, while only 2.2% were upgraded (Ofqual 2020, p135). This meant that students who were awarded their CAG were, on average, advantaged over those whose grades were allocated using the algorithm.
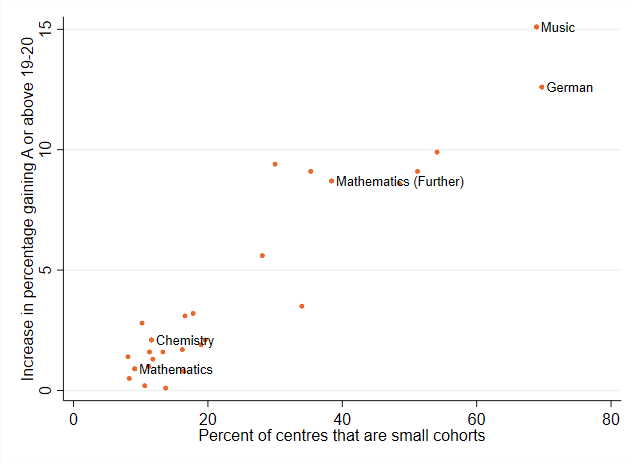
Figure 2 shows the increases in proportion of students gaining an A grade or above in 2020, compared with 2019 (based on the grades published on 13 August 2020) against the proportion of centres that are ‘small’.
For subjects with a higher proportion of centres defined as small, there was a greater increase in the percentage of students gaining A from 2019 to 2020 compared with those with a small proportion of centres defined as small. Thus, students studying minority subjects and students in smaller centres were much more likely to be assigned grades based on the CAGs, and thus higher grades.
Figure 2. Increase in proportion of students gaining an A grade or above in 2020 (compared to 2019) against the proportion of centres that are 'small'

Source: constructed, based on data from Ofqual, 2020a, p133, p128
This raises a potential source of inequality, based on the type of school or college that the student attended. In 2019 in England, independent schools entered, on average, 64 students for A-levels, non-selective academies 91 students, and sixth form colleges 685 students (data from gov.uk, 2020, accessed 24/8/20). Since independent schools are, on average, smaller, there is a higher probability that students were assessed on their CAGs, leading to higher average grades.
This is probably best illustrated in the increase in the proportion of students gaining A or above in the three types of school (Ofqual, 2020a, p136). Independent schools saw the biggest increase in the percentage of students gaining a grade A or above, suggesting that the type of school attended may have affected the likelihood of being awarded a final grade based either solely on the CAG, or a combination of the CAG and the algorithm, but leading to higher grades.

What is meant by the correct grade?
This is not to say that the CAGs were necessarily overestimates. The CAGs were intended as a measure of what a student was capable of achieving. Even the best-designed assessment instrument is likely to include some measurement error.
Consider a student on the borderline between an A and a B. In high stakes assessments, depending on the set of questions that are asked of the student, on a good day, the student might achieve an A, but on a bad day (with a different set of questions), the student might instead be awarded a B (for example, William, 2001). This introduces a random element into the grade that a student gains, which the algorithm could not take into account correctly.
This effect would be magnified in larger centres. For large centres, there could potentially be very large numbers of students close to the borderline, and if grades were being awarded via exam, because of the potential measurement error, the ranking of students may well not match the ranking that the centres would have given before the exam. Since the grades were awarded based on the ranking within the cohort, this would mean with certainty that some students would be awarded the wrong grade.
There is a further risk associated with awarding grades based on the ranking of students in that there may be implicit biases at play within a centre. This might lead to some groups being lower rated than others (see for example, Quinn 2020) based on factors other than their absolute potential.
Finally, we have seen that the algorithm was always unlikely to match the result that an exam would have generated. But this does raise the question of whether (high stakes) exams generate the ‘correct’ grade.
A-levels (and university grades) are criterion-referenced, meaning that students need to be achieving a certain level of understanding of the subject to be awarded particular grades. For example, you might expect a student who is able to demonstrate higher levels of Bloom’s revised taxonomy (Anderson and Krathwohl, 2001), such as analysis or application, to gain a higher grade than a student who has simply remembered key concepts.
But, for example, consider a mathematics exam where one student has seen a question before, and another is seeing the question for the first time. The student who has seen the question before may simply be solving this by memory, while the student who is seeing the question for the first time may need to apply concepts and analyse what methodology is necessary in order to create a solution. While the second student is demonstrating higher levels of Bloom’s taxonomy, a simple exam will award the students the same mark (Newton et al, 2020).
Further, the choice of type of assessment might influence the grades that students actually receive. Coursework, for example, has been greatly reduced within A-levels in favour of terminal exams, but there is evidence that coursework may be less affected by issues such as exam anxiety, and on average (in higher education) students gain higher grades through coursework than through exams (Richardson, 2015).
Because there is an element of randomness in the grade that a student receives from an exam, an algorithm could not hope to match this; the perception among students that the algorithm is unfair stems from the fact that the algorithm was out of their control; had it been an exam, it would have been ‘their responsibility’. But the impossible task of matching the correct grade to the correct student meant that it was always going to be difficult for this algorithm to succeed.
Conclusion
In creating the algorithm to award A-level grades, Ofqual were presented with two competing priorities: the need to award students the ‘correct’ grade; and the need to avoid grade inflation. In targeting avoiding grade inflation, the algorithm led inadvertently to significant numbers of students being awarded grades not only lower than their CAGs, but also lower than their potential. Had Ofqual been more generous for students around the borderlines, then this would have led to grade inflation.
Following five days of negative headlines, the government made the decision to abolish the algorithm, and unless the algorithm lifted the result, students would be awarded their A-level grades based on the CAGs alone.
But in some cases, the delay in moving to CAGs has meant that students may have to delay their progression into higher education. Some courses are subject to space capacity, and popular courses at some institutions may already have been filled by students who were not adversely affected by the algorithm on results day. Some institutions have already offered incentives for students to defer their study until 2021 (BBC, 2020, accessed 28/8/20), reducing the number of places for students due to take A-level exams in 2021.
The algorithm may have caused heartache for students in 2020, but the fall-out may well continue into 2021, with even larger impacts on inequality. Students have experienced an unequal reduction in their education (Burgess and Sievertsen, 2020), and may be facing greater competition for a limited number of university places.
Where can I find out more?
- Schools, skills, and learning: the impact of Covid-19 on education: Simon Burgess and Hans Sievertsen discuss what can be done to mitigate negative impacts of lockdown: major (and likely unequal) interruption in students’ learning; disruptions in internal assessments; and the cancellation of public assessments for qualifications or their replacement by an inferior alternative.
- Minority report: the impact of predicted grades on university admissions of disadvantaged groups: Richard Murphy and Gill Wyness examine the use of predicted A-level grades for UCAS applications; their results find that predictions for UCAS applications are often inaccurate, with 75% of applicants over-predicted. As predictions are a driver for university offers, their results also suggest this is a driver for potential inequality, as high achieving students from more disadvantaged backgrounds are more likely to be given pessimistic predictions.
- A-level results 2020: how have grades been calculated?: Dave Thomson of FFT Education Lab provides some detail about how the adjustments have been made to the available grade distributions, based on the GCSE performance of the cohort.
Who are experts on this question?
- Steven Proud, University of Bristol
- Simon Burgess, University of Bristol
- Hans Sievertsen, University of Bristol
- Lindsey Macmillan, University College London
- Jake Anders, University College London
- Gill Wyness, University College London
- Richard Murphy, University of Texas, Austin and Centre for Economic Performance
- Catherine Dilnot, Oxford Brookes University
- Tom Haines, University of Bath


